See below for a video detailing your portfolio information on Divcaster.
The image below is the main screen for Divcaster. It defaults to your primary portfolio.
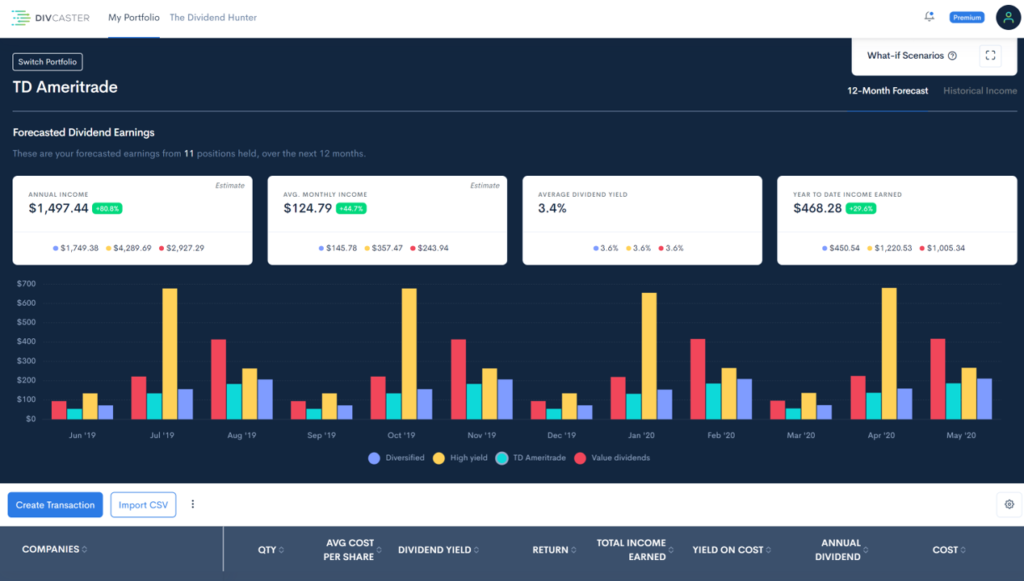
The default view shows a forecast of your portfolio’s expected dividend payments over the next 12 months.
In the example above, each different colored bar represents a different ‘What-If’ scenario for my portfolio.
You’ll also notice the four white boxes at the top. Inside of these boxes you’ll see your portfolio’s:
- Estimated Annual Income
- Average Monthly Income
- Your Portfolio Yield
- Year to Date Income Earned
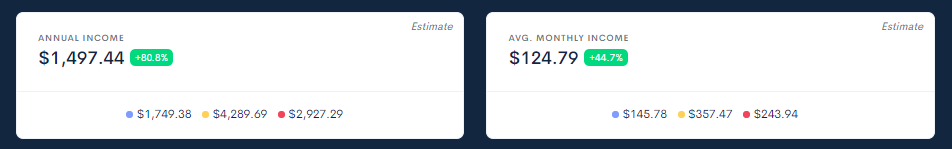
Inside of the box, you’ll notice that I have three other pieces of data next to the colored dots.
When you fill out ‘What-If’ scenarios for your portfolio, this data will populate. So now you can see how your income and yield will change as you make modifications to your portfolio.
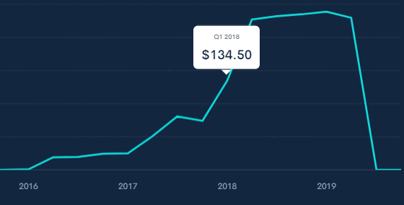
When you click on the Historical Income link (top right of the page)
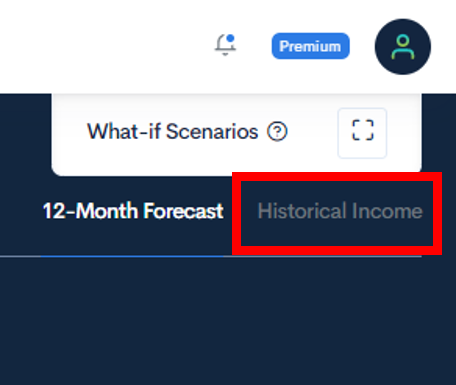
you will be taken to the page featured below.
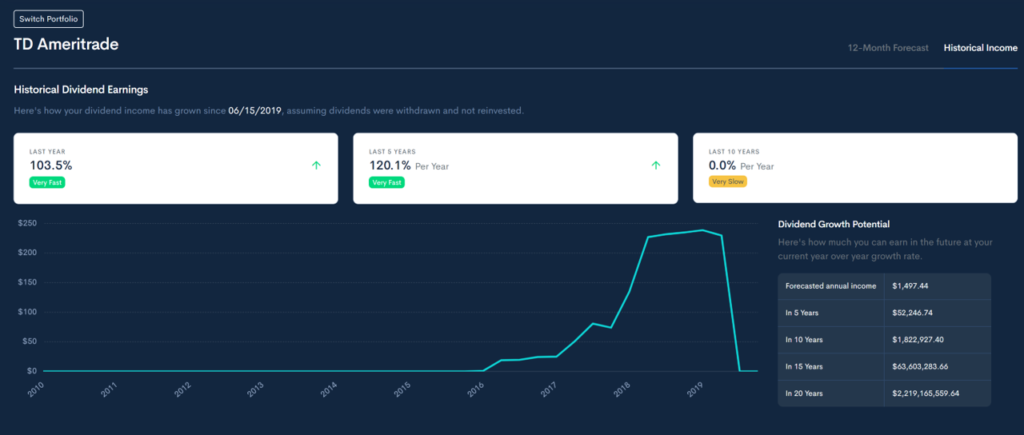
On this page, you’ll be able to see how much income you’ve been earning over the last 10 years quarter by quarter.
Move your mouse to a point over the line graph, and it will show you how much income you earned in that quarter.
You’ll also notice the three white boxes at the top of the page. Here you’ll see the growth rates of your portfolio’s income.
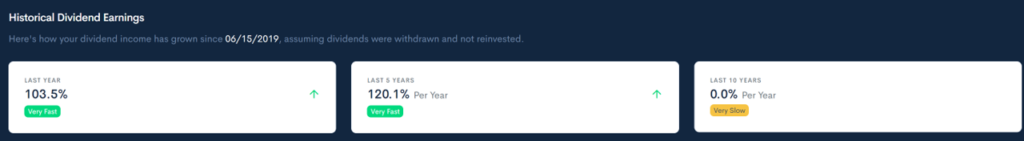
In this example, my portfolio income growth rates are extremely high.
If you have a smaller sized portfolio that you’re investing more money in, you’ll notice that your growth rates will be high.
Over time these growth rates will normalize and give you a great forecast of how much income you’ll be earning in the future. You can see that information in the graph on the right hand side of the screen.
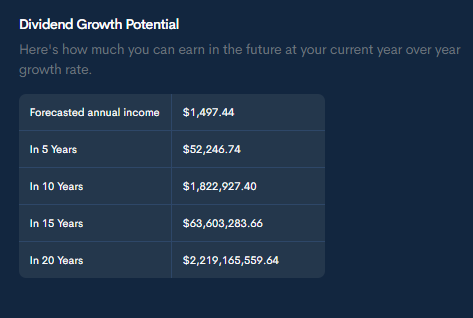
Unfortunately, no I do not think I will become a billionaire in 20 years. But when you have a more mature portfolio, you’ll be able to see how much more income you can earn in the future by increasing your income growth rate.
Now that I’ve gone over the charts, here’s a quick summary on the portfolio information.
Divcaster gives you all the relevant income investing data you need to make great decisions all in one place.
Here’s a snapshot of the portfolio screen:
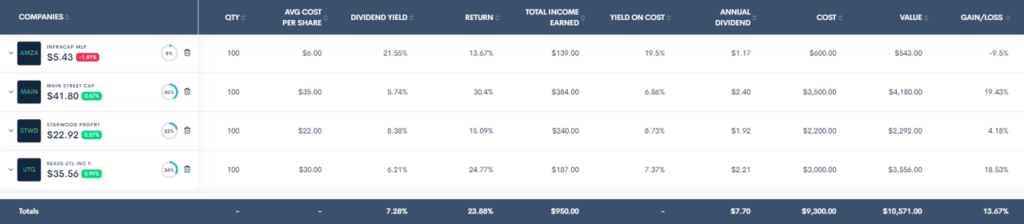
Inside of the portfolio, Divcaster shows you:
- The companies you own
- Quantity of shares you hold
- Your average cost per share across all transactions
- The stock’s dividend yield
- Your total return (which includes dividends received!)
- Your total income earned form your holdings
- Your yield on cost
- The annual dividend of the holding
- The cost of your investment
- Your investment’s value based on yesterday’s closing price
- And your gain/loss based on the stock’s price