The default view of the table below the graph includes the following columns:
- Avg Cost Per Share
- Dividend Yield
- Return
- Total Income Earned
- Yield on Cost
- Annual Dividend
- Cost
- Value
- Gain/Loss
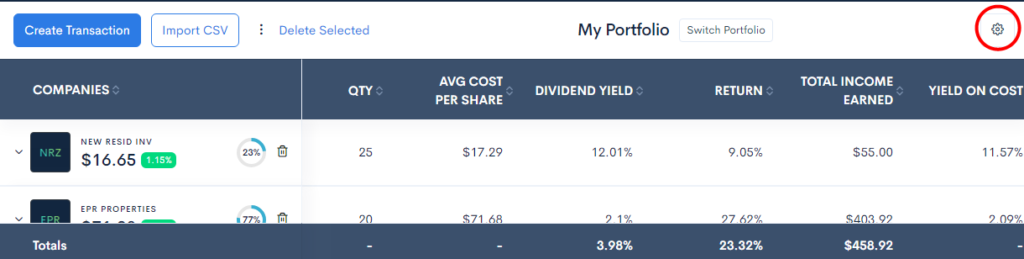
You can hide or display these columns by clicking on the gear symbol at the top right of that table like in the image below.
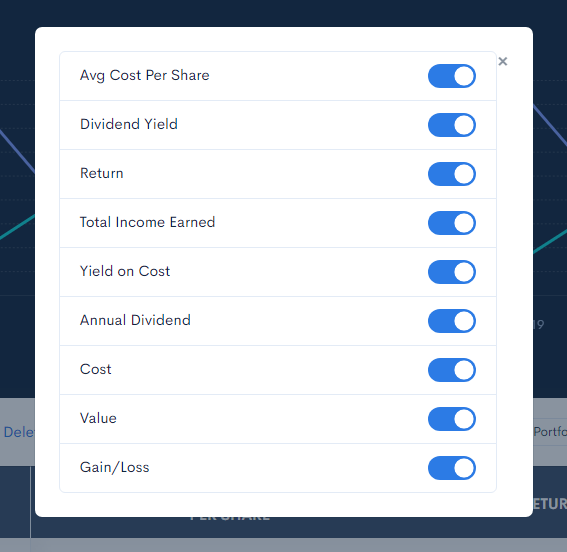
The settings will pop up and you can slide the columns on or off. The changes are instant. Click the X in the top right when you’re done. See image below.