The forecasting chart is the bedrock of Divcaster’s main page. From the chart, you will see your next 12 months of income mapped out for you.

On top of the chart, you’ll see some key portfolio statistics.
- Forecasted Income Next 12 Months
- How much income you’re forecasted to earn
- Average Monthly Income
- Total forecasted income divided by 12
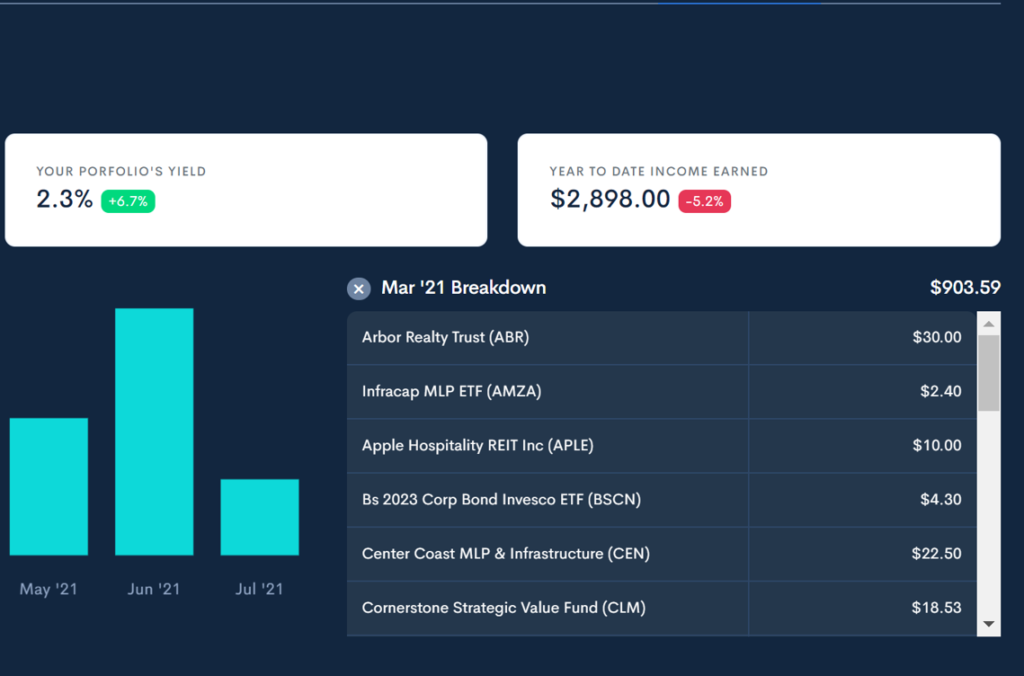
- Portfolio Yield
- Total portfolio income divided by total portfolio value
- Year to Date Income Earned
- Total income earned from January 1 of the current year to today’s date
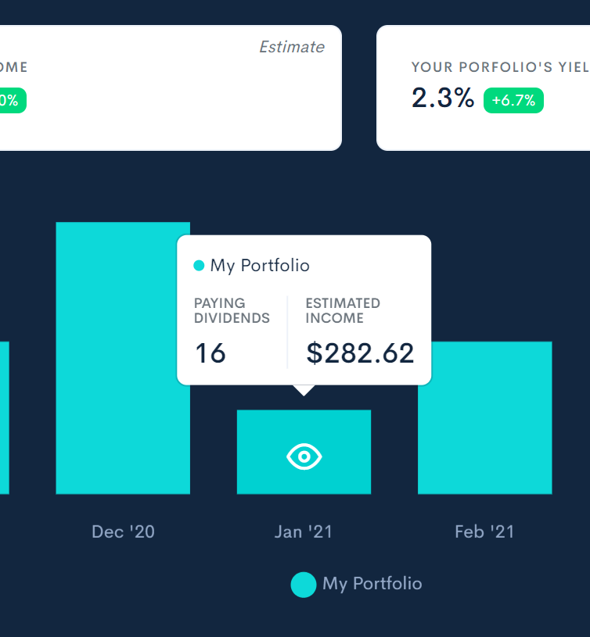
Then, if you move your mouse over one of the columns, you’ll see that month’s forecasted income and how many dividends you are forecasted to earn.
Click on the column and you will open that month’s “Breakdown Table”. Inside the breakdown table, you’ll see all of the stocks paying you a dividend in that month plus your forecasted payment.
To get a more in-depth look at the Divcaster Income Forecasting chart, watch the video below.