In the top right of the Divcaster webpage you’ll see “Historical Income”.
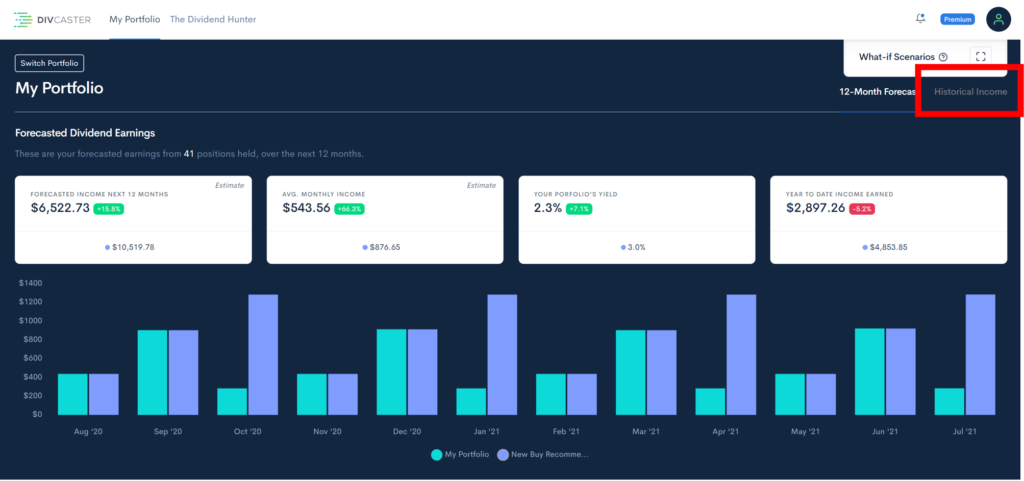
Click on that and you’ll be taken to a line graph that charts how much income your portfolio is earning each quarter.
You’ll be able to see a history of all the income earned since the first transaction in that portfolio. Watch the video below to see a detailed tutorial on all the information the historical income chart offers.